
Test Observability & Engineering effectiveness
“Engineering Effectiveness” has been a central topic of discussion and focus this year

How to Set Up a Build Pipeline on JetBrains TeamCity?
This article will mostly be about TeamCity(in detail) and PlayWright(in short).
The playWright is an automation framework that enables reliable end-to-end testing for modern web apps. More details about Playwright is available here
Now to TeamCity, TeamCity is a general-purpose CI/CD solution that allows the most flexibility for all sorts of workflows and development practices.
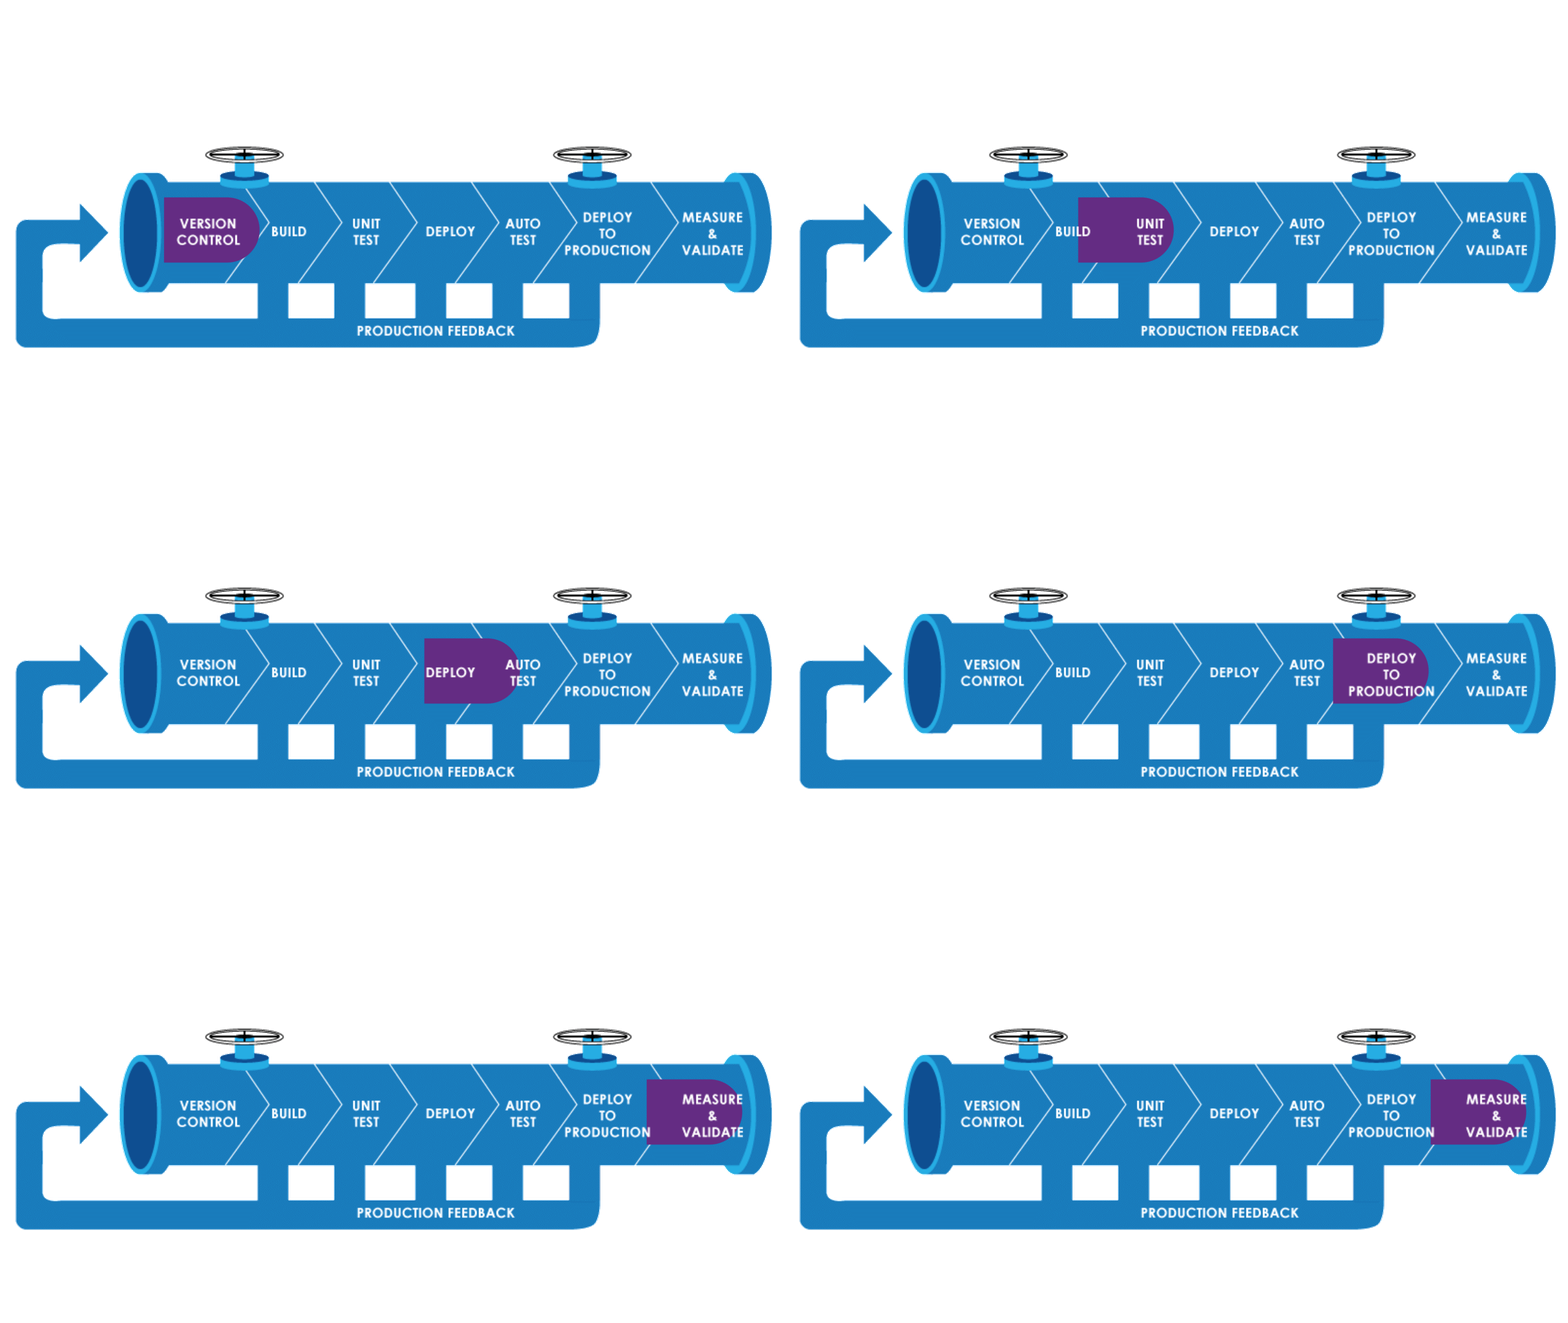
Let’s talk about TeamCity’s key features in detail:
Traditionally when we think about a CI/CD tool like Jenkins we think about a lot of administration, so admins have to set up the tools and configure it with a bunch of plugins so the devs can start using it.
In Jenkins specifically, we have a vast ecosystem of plugins like for example:
This is where TeamCity can help as it gets all these plugins out of the box, you don’t need to install and configure any of those plugins.
TeamCity offers two solutions for configuration, via the UI and via the code.
Let’s talk about config as code first,
When we talk about TC’s Architecture, we mainly deal with two concepts
TeamCity Server: It provides the UI for managing build configurations.
Build Information and result. Think of this as Gitlab or Jenkins UI.
Once the build is configured, they need to run somewhere, for that matter we have build agents.

The process would be:
					docker run -it --name teamcity-server-instance \
-v team_city_data:/data/teamcity/datadir \
-v team_city_logs:/opt/teamcity_server/logs \
-p 8111:8111 \
-d jetbrains/teamcity-server
Once you navigate to the URL (https://localhost:8111), you will see a one-time setup, follow the on-screen instructions and you will be done
The home page will look like this.

Navigate to the admin section and add a new project.

After adding the project TC will try to auto-detect the build-steps from the project.

You may use them or create or own new build steps manually. I’ll be creating a manual step here.

Note the Runner Type is Node.js and uses a docker image for the playwright test.
When we initially start with TC we will have 0 agents as we didn’t configure any. We will again use the docker image to configure our Agent
					docker run -it -e SERVER_URL=""  --name teancity-agent \
-v team_city_agent_config_two:/data/teamcity_agent/conf \
-u 0 -v docker_volumes:/var/lib/docker \
--privileged -e DOCKER_IN_DOCKER=start \
jetbrains/teamcity-agent
PS: We are using -u 0 so that we can perform root actions too. Since we need to run our test in a docker container, we need to start docker inside docker, that is why we using docker_volumes with root access.
How to launch docker inside docker → navigate to the inside of the container and run dockerd
					docker exec -it teamcity-agent bash
root@fecb9be0454f:/# dockerd
Once you have started docker inside docker, you would be able to see an agent, which is unauthorised at this moment. Authorise it by clicking on the button.

Once the above step is done, you are ready to run your test. It should look something like this

Once you have run the build you may want to generate the artefacts for the same.
navigate to project setting → General setting and you should be able to do the same. Choose the file whatever you need to have in your artefacts and you do.
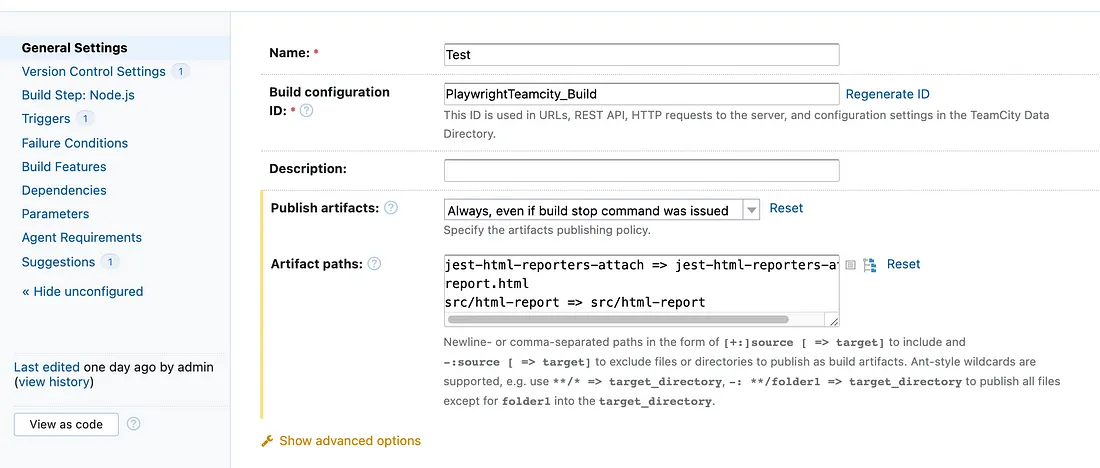
For any kind of automation testing be it unit or functional, reporting is a must as it will educate you with the test result, screenshot etc.
for setting up: Navigate to Root project setting → Report Tabs

There are two tabs available for reporting:
Build Report Tab → This will have to report for every build you are building.
Project Report Tab → This will have a report for the project itself.
You can have either of them as per your preferences.
Once we have everything in place, this is how the result of the build will look like.
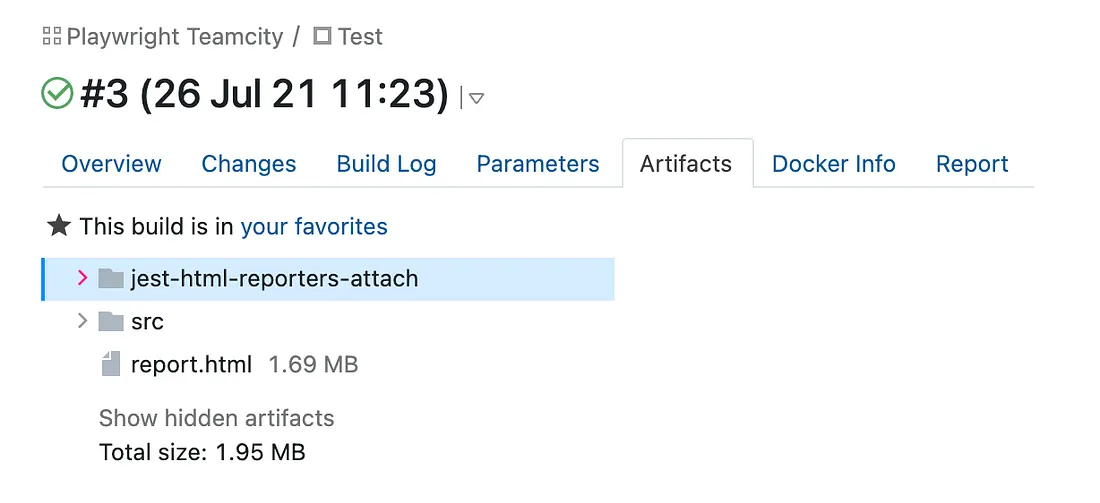
From a code perspective it will look something like this:
					package _Self.buildTypes

import jetbrains.buildServer.configs.kotlin.v2019_2.*
import jetbrains.buildServer.configs.kotlin.v2019_2.buildSteps.NodeJSBuildStep
import jetbrains.buildServer.configs.kotlin.v2019_2.buildSteps.nodeJS
import jetbrains.buildServer.configs.kotlin.v2019_2.triggers.vcs

object Build : BuildType({
    name = "Test"

    artifactRules = """
        jest-html-reporters-attach => jest-html-reporters-attach
        report.html
        src/html-report => src/html-report
    """.trimIndent()
    publishArtifacts = PublishMode.ALWAYS
vcs {
    root(HttpsGithubComThenishantPlaywrightTeamcityRefsHeadsMain)
}
    steps {
        nodeJS {
            name = "test"
            shellScript = """
                npm install
                npm test
            """.trimIndent()
            dockerImagePlatform = NodeJSBuildStep.ImagePlatform.Any
            dockerImage = "mcr.microsoft.com/playwright"
        }
    }

    triggers {
        vcs {
        }
    }
})
The project is available on Github
That’s all for now. Let us know your thoughts.
Share This Article

“Engineering Effectiveness” has been a central topic of discussion and focus this year

With us, you’re not just a part of a company; you’re part of a movement dedicated to pushing boundaries, breaking barriers, and achieving the extraordinary.
Otaku 2.0 sought to redefine the way we approach testing, celebrate the spirit of innovation, and pave the way for a brighter future in tech.