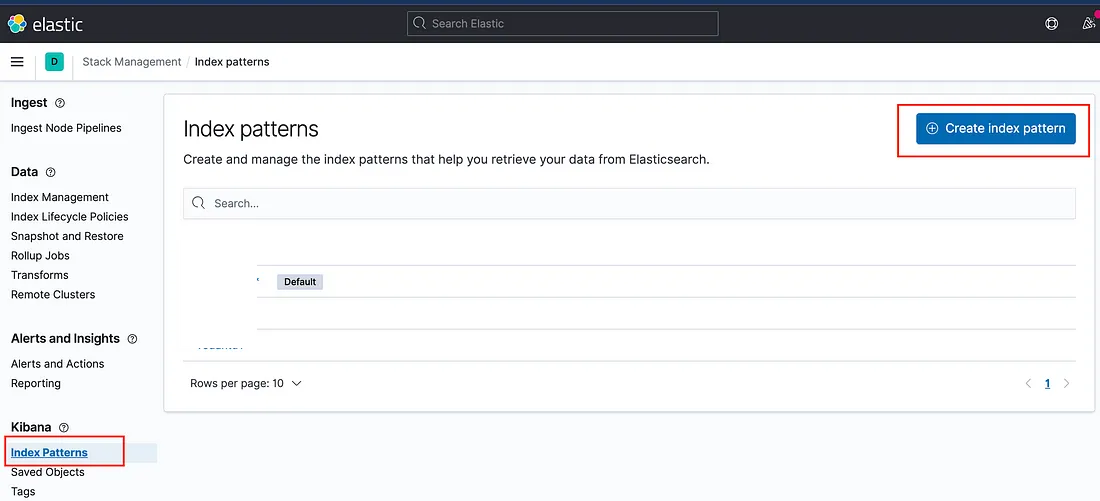
TestVagrant

How to Build a Real-Time Test Case Monitoring Solution using Logs?

How to build a Real-time Test Case Monitoring solution using logs?

Blog

How to build a Real-time Test Case Monitoring solution using logs?

any of us have heard about monitoring logs via real-time dashboards like Kibana, Grafana and etc while working with the development team. As a QA, It’s always fascinating to check the test case logs in a real-time dashboard that is easily accessible from anywhere and anytime.

Today, We will have a look at how we can have a real-time dashboard that will show us the test cases running and generating logs. This will help us to understand if there are any issues at a very early stage.

To do this we will be using the approach of ELK.

So, what is the ELK? “ELK” is the acronym for three open source projects: Elasticsearch, Logstash, and Kibana. Elasticsearch is a search and analytics engine. Logstash is a server‑side data processing pipeline that ingests data from multiple sources simultaneously, transforms it, and then sends it to a “stash” like Elasticsearch. Kibana lets users visualize data with charts and graphs in Elasticsearch.

Note: As of now, We will be working only with Elasticsearch and Kibana.

In this blog, We will be running elasticsearch & kibana on docker as it will provide less load to the local system and is easy to configure.

Setup

Let’s run the below commands in the terminal after docker is up. 

				
					$ docker run -p 9200:9200 -p 9300:9300 — name elasticsearch -e “discovery.type=single-node” docker.elastic.co/elasticsearch/elasticsearch:7.11.1


The above command will pull elasticsearch engine image and will start the server.

Once the Elasticsearch server starts, Now hit the below command to start Kibana as Kibana will be working internally with elasticsearch to get the data.

				
					$ docker run -p 5601:5601 — name kibana — link elasticsearch:elasticsearch docker.elastic.co/kibana/kibana:7.11.1


Once both these containers are up and running. Navigate to the below link

				
					http://localhost:5601/


This will open Kibana Dashboard.

Seeding data to elasticsearch

Now, It’s time we need to add data inside elasticsearch for indexing, It can be done with the help of API.

We will use Postman as of now to insert data in elasticsearch. (You can configure the same in the framework which will send the test case data after executing to ElasticSearch). We need to hit the endpoint with payload.

				
					Endpoint: http://localhost:9200/example/tc1
Payload :
{
"testName": "testcase1",
"module": "Payments",
"status": "Pass"
}


When we will hit the above endpoint with the POST method, We are inserting this payload to elasticsearch under type “example” and there will multiple requests would be made and in that case, elasticsearch will save these data in the form of indexing.

Once we have pushed the data that we wanted in elasticsearch. We will not move to create a dashboard. This dashboard will keep on monitoring elasticsearch for the data that is getting pushed and will visualize the same on the dashboard.

Configuring elasticsearch to generate index pattern

To create a dashboard in Kibana, We first have to generate index patterns for the data coming from elasticsearch.

To create an index pattern, Hit elasticsearch URL http://localhost:9200/ navigate & click on Stack management.

Then under stack management, Click on index pattern & click on create index pattern.

Then search for the type under which we have pushed our data using the API. For this blog, “example” is the type under which we pushed our payload. Select the type and click on the next step. You can select the time field from the dropdown. Now click on create index pattern.

We are done with creating the index pattern.

Discovering logs using kibana

Now, Let’s discover and check if we are getting the logs on kibana.

Click on the hamburger menu on the top left corner & select Discover.

Click on the filter drop-down and select the type that we had added in elasticsearch.

Now, Change the dates and click on refresh. You will see the logs that are getting generated when the test cases run.

You can also, configure the dates and times in such a way that it keeps on refreshing at regular intervals to get real-time data.

Conclusion

With these easy configurations, We can see what exactly is happening around when your test cases are running. Also, it becomes very easy to catch any discrepancies way before the entire execution is completed.

Other use cases

We can add dashboards with the same elasticsearch configurations to get the entire execution details in graphical format.

References

  1. Elasticsearch — https://www.elastic.co/elastic-stack/
  2. Kibana — https://www.elastic.co/guide/en/kibana/master/api.html

Stay tuned for my next blog on creating real-time dashboards with Kibana.

Share This Article

Other Related Articles

Scroll to Top